09 August 2017

Data bites: confusing cross-tabulations


Some recent research from a sample of 957 members of PureProfile's Australian panel showed that people who classified themselves as "Early Birds" were two times more likely than "Night Owls" to earn over $70k per annum.

Specifically, 23% of Early Birds earned over $70k p.a. vs just 11% of Night Owls.

Does that mean that 23% of those who earn $70k+ are Early Birds and 11% are Night Owls?

Nope. If that were true, that leaves two-thirds (66%) of $70+k earners who are neither Early Birds nor Night Owls.

Does the result mean that there are more Early Birds than Night Owls earning above $70k per annum.

Not necessarily.

If the Night Owls are far more numerous than Early Birds in the total sample, then it is quite feasible for there to be more Night Owls who earn $70k+ even while Early Birds are two times more likely to earn $70k+ than Night Owls.

Making this error is very easy - unfortunately - and even downright confusing in some situations. Here's an example that can seem particularly confounding.

PureProfile's research showed that in the Australian population, men are more likely to be Early Birds than women. About 56% of men are Early Birds compared with just 45% of women (see yellow shading in table below).


However, when we turn the result around so it expresses the proportion of Early Birds (and Night Owls) who are male vs female, we may be surprised to see that 50% of Early Birds are women and 50% are men. (In actual fact, there are slightly more women who are Early Birds than men as we will see in a moment).


Whaaaaaaaaaaaaaat? How can that be?

The problem is one that often confronts us when we do crosstabulations. A crosstabulation (often shortened to crosstab) is simply breaking down the frequency of responses on one variable by groups (in this instance, the groups are male and female).

People tend to get confused because they see the first result (56% of males are Early Birds), and think that this is equivalent to saying that 56% of Early Birds are males.

But this simply ain't so.

Let's break this example out. First, here's the raw counts in each cell. In this sample, there are 945 males who are Early Birds - or 945 Early Birds who are male if you prefer. It is the same thing!

And note that there are slightly more women who are Early Birds than men: 951 women vs 945 men.


The proportion (or per cent) of males who are Early Birds depends on the total number of males there are in the column.


The proportion of Early Birds who are male depends on the total number of Early Birds there are in the row.


So, in a nutshell, there are 945 males who are Early Birds. This represents 56% of the total number of males (column %), but just a fraction under 50% of the total number of Early Birds (row %).

The key takeout is this. Whenever a percentage is being reported, take note of the base. Are you looking at the % of the column (in which case the sum of the column is 100%) or the % of the row (in which case the sum of the row is 100%).

Understanding this distinction is important - and surprisingly often misunderstood. Here's one extreme example to highlight the problem.

Nearly 100% of sexual assaults are perpetrated by males but that does not mean that all males (or even a high percentage of males) are molesters/rapists - thankfully.

However, that doesn't stop many parents, airline policies and even national news anchors from treating all men as potential molesters. Most molesters are male, but most men are not molesters. Again, thankfully.

Drawing this conclusion, and worse, enacting policy based on this result reflects a gross misunderstanding and misinterpretation of the statistics. And it happens to lead to inappropriate stereotyping of a lot of good men. If interested, you can read more about this case here.

How to minimise the danger of this error?

Whenever reporting a percentage, be very clear about what is the base, ie x% of what? Quite simply, % of men is not the same as % of Early Birds.

Meghan Trainor - it's all about the base!

If you're preparing crosstabulations (crosstabs), I generally recommend (and myself, generally present) column percentages only. That way, you know you're always comparing the % of column 1 to the % of column 2.

But what goes into the column and what goes into the row? Generally, we try and put the Causal factor into the Column, and the Result into the Row. As sex is generally decided many years before we begin to decide whether we like to get up early or stay up late, sex is the cause (put it into the column) which is thought to determine the result, namely, whether or not you are an Early Bird.

If you do want to swap it around (and see what proportion of Early Birds are female vs what proportion of Night Owls), swap the row and column variables and rerun your crosstabulation. That way, you are still reading column percentages. (It can still be confusing, but hopefully less so).

And practice. Swap the rows and columns, see if which makes most sense.

Above all, do not mistake the per cent of the column to be the same as the per cent of the row.

01 June 2017

Sharing wisdom: reflections on the road to the country for old men

M.C. Escher
Not everyone is lucky enough to journey into the "country for old men" (and women). And even among those who are lucky enough to reach old-age, not all learn as much from the journey as they might. Some arrive at the destination having missed the journey.
Growing old is inevitable, growing up is optional.

Is practical wisdom valuable?

Even in a society which is increasingly technical and technological, there is some sense that wisdom is a worthy goal, a knowledge worth attaining. Adapting the words of Aristotle in Nichomacean Ethics only a little, we can see that his observation applies still today:
"Although the young may be experts in geometry and mathematics [and technology and computers] and similar sorts of knowledge, they nonetheless lack practical wisdom. Such wisdom is gained from experience which the young do not possess, for experience is the fruit of years." (adapted from Nichomachean Ethics 1142a).
So even while we may rely on our children, our grand-children or both to help us download apps to our mobile phone, to show us how to connect our "smart" television to Netflix and how to stream music through Spotify to our tablet and other devices, there is still a place for wisdom.


25 May 2017

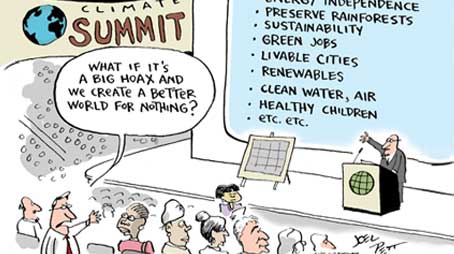
Skepticism: are you willing to change your mind?

Joel Pett (2009) USA Today
"The trouble with the world is that the stupid are cocksure and the intelligent are full of doubt." 
-- Bertrand Russell

Skepticism has received an increasingly bad name - but most of that is from mis-attribution. 

Skepticism can be usefully distinguished from denialism - even though the word skepticism is used to describe anti-vaxxers to climate-change deniers, 

In some instances, skepticism is used as a synonym of denial as in "I am skeptical about your claims", or "I doubt that what you say is true".

However, skepticism is more uniquely used to describe the notion of uncertainty - as in "I'm uncertain about the truth of what you say", or more simply, "I am uncertain about what is true".

20 September 2016

Research lessons from Census 2016 - making sense of a senseless fail

Let's admit - it's a trainwreck 
The ABS is threatening two million households with fines if they do not complete their census at the same time as being "adamant the quality of data has not been compromised."

It's not so long ago that they reassured the public they would be able to cope with the demand on census night. They were wrong then - and they are wrong now.

The data quality has been hopelessly compromised. For one thing, at this point in time, there are two million out of "close to 10 million dwellings"  that are yet to complete. That is, 20% who have not completed yet.

In the short run, #censusfail was about a data collection problem. The website for collecting the census data was inaccessible on the night of the census at the time that most people would have completed the census form. It remained inaccessible for a further 48 hours. Even longer for some.

The initial response to this colossal data collection glitch was a flurry of fingerpointing and promises that "heads will roll."

However, the bigger problem appears to have been totally overlooked. The real crux of #censusfail is less a data collection fail and more a data quality fail.   

11 April 2016

Gender equality as a fantastical fairy tale


According to the magic mirror on the wall, Snow White was the fairest by far. 

But that's not fair! And so the beautiful but vain stepmother set about fixing the problem.

We detest inequality in general, but we can easily confuse this with the detest of those who have more than me.  We battle inequality, but we overlook what we have, and also what others have not.

That "Harry Potter girl" Emma Watson, charmed us with her reminder of the dimensions of inequality that we fail to consider. And the appearance afterward of trolls and witch-hunts simply underlined her point.

In missing the inequalities, we miss the solutions too. Annabel Crabb observes that career women are frequently asked about how they manage their family lives while men never are. Her solution is simple: "I don't think the answer is to stop asking women. The answer is to start asking men."

Asking both working women and men about how they manage their home life highlights that someone must manage it, hence the title of Crabb's new book: The Wife Drought.

Unpaid domestic labour is not generally counted in measures of economic activity but is estimated to be equivalent to up to half of Gross Domestic Product.

Who does the work at home? Women do. At a rate almost two times that of men and even greater if they have children. This is true even in fairytales. The seven dwarfs agreed to protect Snow White in return for unpaid household labour.

Both types of work have to be done. Men do about two-thirds of the paid work, women about two-thirds of the unpaid household work.

Men are generally expected to provide and do so, even at a personal cost which often becomes apparent only at their deathbed. Working too hard is one of the top regrets of the dying says Bronnie Ware, and particularly among men.

Statistics show that men have higher rates of pay than women with one notable exception. The fairer sex makes a good deal more than men in fashion modelling.

Statistics also show that men have higher rates of being victims of violence, assault, work-related injuries, suicide and earlier death.

As Sam de Brito quips, "I'm surely not the only man who'd be happy to swap my 8 per cent for an extra five years of life, more time with my kid and the guarantee I'll not be found swinging from a beam when I turn 55."


Just as a corporate women must explain how she manages her home, stay-at-home fathers must explain why he is neglecting his career. Fathers stepping up to help in the family are questioned, literally and figuratively. We do not seem to like men being around children as reflected in the following:
  • Male child carers are bound by special rules
  • Tracey Spicer provides public support to airline policy ensuring men are not seated next to unaccompanied minors
  • Lenore Skenazy documents multiple other examples in an article entitled “Eek, a male!”
The book The Other Glass Ceiling provides other instances of man-fear: a dad shopping for his daughter's undies is deemed a security risk; a single father searching for an au pair is suspicious.

We don't even realise we're treating others unequally. Consider the following scenario:

"Chris is a single parent of two and the director of marketing for an electronics firm. Scheduled to present the key quarterly sales report to the Board, Chris arrives 15 minutes late after dropping the children at school and day care. In addition to dishevelled hair, there is a noticeable stain on Chris’ suit, the result of the young girl vomiting at the end of her car trip after a hurried breakfast."

Research shows that 95% of people think that Chris is a woman. But Chris' gender was not stated. We often fail to see our own unequal treatment of others.

Striving to reduce inequality is important, but equality is a myth. Men and women are not born equal and even the most earnest efforts cannot rectify all the inequalities as the Monty Python team explain to Loretta.

And some efforts to reduce inequality create more damage than good. According to relationship expert John Gottman, when communication is reduced to criticisms and contempt, the relationship is in trouble.

The gender-war is not helpful. In tackling one inequality, we may create another. In the original Snow White, the evil stepmother is forced to put on burning hot boots at Snow White's wedding and dance until she dies.

The moral of this tale is that equality is not even true in fairy tales. Our goal is to reduce inequality, to exchange inequalities.

Ask both women and men, "How are you managing your home life?" Encourage fathers to step up and mothers to let go.

Now just share your toys nicely, and we'll all live happily ever after.

13 September 2015

Better to be uncertain than certain and wrong

Researchers cannot escape uncertainty

Uncertainty is a paradox. On one hand, it is a potent and powerful force that motivates research, a need to know. The gratifying result of research is evidence used to guide practice and policy.

On the other hand, uncertainty always remains after research because of the inherent complexity and ambiguity of the real world. So policy-makers and practitioners are (or ought to be) troubled about inevitable residual doubt. Examples include what to do about climate change, what body mass index is ideal and whether to test for prostate cancer.

Why uncertainty remains

Research may help reduce uncertainty, but it can never provide certainty. Research is an errorful process that peers into an obscure reality.

16 June 2015

A home of your own: dream or delusion?


The appeal of owning a home seems deeply embedded in the psyche of Australians. Yet psychologically, it is not clear the home ownership dream is entirely rational. Achieving the dream may not be all we might have hoped, and chasing it may even do damage.


The psychological reason Australians want to own their own home is perhaps best expressed by Darryl Kerrigan in the uniquely Australian film, The Castle. It continues to be celebrated globally for showing that the house is just a shell that holds heart. To own your own home has a strong sentimental value, as Darryl says: “You can’t buy what I’ve got.”

06 June 2015

Obesity, a wicked public health problem

Most people view obesity as an unequivocal bad -- both for the person and the public. But obesity is a wicked problem. That is, the obesity problem is ill-defined, characterized by complex and contradictory evidence, and unresolved due to conflicting judgments of what is "good" or "bad".

Just one example of how the problem has been oversimplified is in identifying "big food" as the enemy, just like big tobacco before. 


Marketers of food are soundly critiqued for creating large, super-sized portions.

However, in a nod to the wicked nature of the problem, marketers are also critiqued for offering smaller portions. 
And rather more ironically, marketers are also criticised for promoting slim,
"overly-idealised" body-forms. 


The media, public health and popular views all share the view that obesity is a problem, but the real nature of the problem is more complex than many seem to realise.

17 April 2015

Vaccinate or don't - it won't hurt much either way

Is there a middle ground in the debate on vaccines?
The debate about whether to apply more coercive pressure to vaccinate such as the ['no jab no pay' policy] is being clouded by polarised polemic.

Each side appeals to a reasonably valid ethical claim: pro-vaccination to the public good, anti-vaccination to individual rights.  However, these ethical claims sometimes seem to serve vested self-interest rather than public interest. Moreover, that self-interest reflects an over-estimation of the relative risks to health of vaccination and non-vaccination respectively. 


25 September 2014

Don't understand statistics? Wanna bet?

Guess the number of 'heads' out of 10 coin tosses, and you can keep this.
I think we tend to belabour the problem of statistical significance testing sometimes. The whole process is very intuitive.

Let me take you through a thought-experiment to show you this.
"I'm going to toss a coin 10 times. And to make it interesting, let me put this pineapple (Australian $50 note) on the table and make you this offer:
"If you guess the exact number of heads in the next ten coin tosses that I make, I will give you the $50. If you don't guess it exactly, I get to keep my $50. Are you willing?"
So assuming that you see that participating in this gamble is a "no-brainer", you say:
"Yes, sure." 
So what number of coin tosses will be heads? Make your guess now.

Use the illusion: see more and eat less

Trompe l'oeil - making portions look bigger can help reduce consumption
Science has revealed a simple and incredible trick that will help you lose weight. 

No fooling! Or rather, by fooling your eye, you may get the desired result.

The trick is to make portions appear bigger than they are. This leads people to serve and eat less.

We know that bigger portions lead us to eat more (bite-size version here), but portions that appear bigger have the reverse effect.

14 September 2014

Inductive reasoning or deductive reasoning?

There are two ways that we come to have knowledge. One is by reasoning from repeated observations (inductive), the other is by ensuring the conclusion follows validly from the premises (deductive). 

The two are inextricably linked. Each makes an argument that helps advance our knowledge of the world.

More surprisingly, each argument fails by the standards of the other!


Inductive vs deductive reasoning

Inductive reasoning is about coming to a conclusion from specific instances (empirical data), deductive reasoning is about coming to a conclusion from premises (logical reasoning).

03 September 2014

To find smash-hits, ignore statistical significance !

It's not the end of the world if you're wrong !

The biggest mistake in market research is to worry about being wrong.

Ironically, research can learn this lesson from one if its great detractors, Steve Jobs. He who famously dismissed market research saying "People don’t know what they want until you show it to them".


He was right about customers' lack of self-insight, but wrong about the value of research.


Businesses want blockbusters, to crack the big time, go viral, be trending (upwards). They want and count hits as Steve Jobs knew and proved.

03 May 2014

Flying high: sexism, paternalism and sheer idiocracy

What are the dangers to a kid flying alone ?
Airline policies and parents concerned about allowing unaccompanied minors to be seated next to men make a travesty of both reason and justice.

That this fear feeds paternalistic policy and parental concerns is ludicrous.

If you send your child unaccompanied on a plane, your child has more chance of dying in a plane crash than being molested!

Tracey Spicer, journalist and Sky News anchor has recently affirmed her support of this controversial airline policy saying “I don’t want my kids sitting next to a man on a plane.”

Her statement is, as she admits, sexist. It most certainly is, but my major issue is that it is patently wrong and misleading.

It is said that we use only 10% of our brain, that 20% of statistics are made up, and the remaining 90% of the population aren’t any good at proportions.

14 February 2014

In defence of uncertainty: Against the wrong of righteousness

Weather to carry an umbrella ?!
In polite conversation, topics like sex, politics, and religion are widely regarded as off-limit. Today, public policy issues like climate change and public health (vaccinations, naturopathic medicines, fast food marketing, etc.) also provoke such polemic that useful debate is impeded.

It is not the topic that is the problem. 
 
It is that positive, meaningful conversation on these topics descends all too quickly from a meaningful dialogue to dogmatism, from disagreement to disagreeableness.

How do you turn an intelligent conversation into a ideological battle? Allow participants to advance confidently held, but opposing beliefs while assiduously denying uncertainty.

12 April 2013

Seeing gender differences, blind to individuality

We love looking for gender differences. And then code them as blue and pink.

Marketers do it in order to better target a specific segment.  Humans do it because it is simpler to deal in stereotypes.

The problem is that gender differences are less clear than we are inclined to think. In fact, some 'differences' are completely artificial such as the dress and hair-styles of men and women. It's painted pink and blue, but may be there's no difference underneath.

Men have an outie, women have an innie. Fact.

Women are shorter than men. Sort of. It may be true on average, but it is not universally true.

Gender differences are typically a matter of degree with the distributions of men and women overlapping to a great extent. They are not categorical.

Where to draw the line? Statistics can help, but it is not perfect.

More importantly, generalising about gender differences based on statistically significant mean-differences oversimplifies the reality, and may support stereotypes that discourage or even oppose individual choices.

Seeing gender differences can blind us to individual variety and preferences.

Read more here: Gender differences: more fictions than fact

(If the link does not work, paste the following into our browser: https://theconversation.com/gender-differences-more-fictions-than-fact-11725)

13 March 2013

Who holds the power in marketing: the marketer or the customers?

We often like to 'blame'  marketers for pushing people to buy stuff that they do not need. 

On the other hand, customers often demand, and go to great lengths to source stuff which does very little. 

Think of things like rhino horn, homeopathy, anti-aging cosmetics, and status-related items. These items often fail to meet the wants of the customer to a greater or lesser degree. But customers keep on demanding them.

So does marketing succeed because of the marketing efforts or the customer desires?  And if it fails, is it the marketer or the customer who is to blame?

What do you think?

Consider resveratrol, a naturally occurring molecule found in red wine.  Here's my take on the interplay of marketers and customers in the marketing of resveratrol.

(Paste the following link into your browser if the above hyperlink does not work: https://theconversation.com/resveratrol-in-a-red-wine-sauce-fountain-of-youth-or-snake-oil-12743)

25 February 2013

In praise of critical thinking

Bertrand Russell's call for you to think for yourself. 
  1. Do not feel absolutely certain of anything.
  2. Do not think it worth while to proceed by concealing evidence, for the evidence is sure to come to light.
  3. Never try to discourage thinking for you are sure to succeed.
  4. When you meet with opposition, even if it should be from your husband or your children, endeavor to overcome it by argument and not by authority, for a victory dependent upon authority is unreal and illusory.
  5. Have no respect for the authority of others, for there are always contrary authorities to be found.
  6. Do not use power to suppress opinions you think pernicious, for if you do the opinions will suppress you.
  7. Do not fear to be eccentric in opinion, for every opinion now accepted was once eccentric.
  8. Find more pleasure in intelligent dissent than in passive agreement, for, if you value intelligence as you should, the former implies a deeper agreement than the latter.
  9. Be scrupulously truthful, even if the truth is inconvenient, for it is more inconvenient when you try to conceal it.
  10. Do not feel envious of the happiness of those who live in a fool’s paradise, for only a fool will think that it is happiness.
Bertrand Russell, A Liberal Decalogue (i.e., Ten Commandments) which appears at the end of his 1951 article "The best answer to fanaticism--liberalism"

He underlines his point by having been avid smoker for most of his life, even claiming it saved his life one time.  

(Thanks to Maria Popova at Brainpickings for leading me here).

05 December 2012

Tough lessons for trainers & teachers

TEACHER: Millie, give me a sentence starting with 'I'.

MILLIE: I is..

TEACHER: No, Millie..... Always say, 'I am.'

MILLIE: Alright, I am the ninth letter of the alphabet.

------------------------------

TEACHER: Harold, what do you call a person who keeps on talking when people are no longer interested? 

HAROLD: A teacher.

------------------------------


28 November 2012

The risks of immunisation & implications for social marketers


Social marketers confront some extra ethical challenges that do not confront commercial marketers.

When you are given a medication by a doctor, you get to read all about the possible side-effects and decide on whether the benefits offset the risks.

When the medication is a vaccination, the same freedom of choice for the individual is more restricted.  An individual decision to not vaccinate may attract criticism, ridicule and even rage.

Yet, vaccinations can be harmful to your health.  Admittedly rare, but when it happens, someone (maybe you, maybe your child) 'takes one for the team.'

This is a tough space.  Public health and social marketers are therefore obliged to tackle the difficult space defined by what is 'good for all' on one side and an individual's right to choose on the other.

------------------------------

See this article at The Conversation covering this issue.
http://theconversation.edu.au/preaching-to-the-unconverted-immunisation-risks-and-public-health-11007

10 November 2012

Statistical significance is just like a horse race


Green Moon had a chance of less than 1 in 22 of winning the race
The logic of statisticians can seem very complicated and impenetrable to normal folk.

But it really is just a formalised version of our own lay style of how we explain unusual events.

When something unusual happens, there are two possible interpretations.  One is to view the unusual event as a freak occurrence, a chance-result, a coincidence.  The other is to view the event as a sign that our understanding of what is going on is fundamentally wrong.

So, is the unusual event simply surprising or does it stretch credulity?  Did we see a rare occurrence or is there some other explanation?

It's a bit like interpreting the result of a horse race won by a horse with long odds.  Is the win a possibility even if improbable, or is it so improbable as to be considered an 'impossibility' requiring a brand new explanation.

Read more on this idea in this article posted on The Drum / ABC : The Melbourne Cup and Statistical Significance

11 November 2011

Building better brand metrics : multi-collinearity as friend rather than foe


Multi-collinearity looks more complicated than it is !
Metrics are hot.  Multi-collinearity is not.  

Multi-collinearity.  It is a big word – and a big mystery to many students of statistics and even practitioners – just like the word, heteroscedasticity!   

The existence of multi-collinearity actually makes the world a simpler place in a practical sense.  

Are your clients currently enthused by Balanced Score Cards, Brand Metrics, Net Promoter Score and various other tools that consist of many apparently independent measures for assessing the health of a company and/or brand?  Well, stay tuned because it does not have to be that hard, as multi-collinearity will show!

Multi-collinearity is simply the problem of two predictor variables being correlated with one another such that the contribution of each to the criterion is difficult to tease apart.  Imagine trying to predict purchase intentions, and we measure both ‘price’ and ‘value.’  Clearly both are useful for predicting purchase intentions, but the two are also very likely to be correlated to one another.  This means that once we know one, the other does not add much to our prediction.

Okay, we understand the problem, but do we understand how often we encounter this situation?  And how often we may be misrepresenting the results to our clients as a consequence of many correlations between the predictor variables we report to our clients?  If you are using any kind of multi-attribute rating models (e.g., Vroom’s expectancy-valence model, Fishbein & Ajzen’s original attitude-model, Gale’s Customer Value Analysis model, etc.), then you are likely encountering this problem.  These are the models where you measure how customers rate various attributes of the brand, and use these ratings to determine what are the ‘drivers’ of brand purchase.

Typically, ratings of any brand on these attributes are highly correlated.  For instance, if you chose to assess ratings of ‘price’ and ‘value’ as two separate attributes, they will typically be highly (negatively) correlated.  In a multiple regression, the result is that one will contribute significantly to the regression, and the other one, because it is highly correlated to the first, will not.

‘Aha,’ you say, ‘but I take explicit measures of the importance ratings.’  Yes, well unfortunately this does not solve the problem.  As most of us know, respondents will typically tell us that all attributes are pretty important.  You can play games with constant-sum scales that helps differentiate importance, but you are still not dealing with the problem of what I might call non-statistical multi-collinearity.  The problem is that if you ask a respondent how important is ‘value’ and how important is ‘price’, they will probably give a fairly equal importance rating to both.  Why wouldn’t they – they are really much the same!

What is the solution?  One suggestion is to retain just one of the multiple correlated items.  This is certainly one solutionn – and links to a tangential issue about better quality drafting of questions.  If we can anticipate ahead of time that two attributes are going to be highly correlated, we can consider measuring just one or the other.

However, I am also a great believer in combining separate items collected on a questionnaire as they provide a more stable (reliable) measure than using a single item.  That is, I measure multiple attributes, even if they are likely to be correlated.  Then, I conduct an examination of the intercorrelations of the various attributes to see if I can simply combine two or more items into one scale.  If I want to be really sophisticated, I could conduct a factor analysis for guiding the combination of items. This allows for a sophisticated weighting of each variable in the final ‘scale.’  However, I generally find that clients (and analysts) find simple, averaged scales much easier to interpret than factor scores. 

However, one rather disturbing result that I have found in examining these intercorrelations among attribute ratings is many of the ratings are correlated with many of the others!  Even among sophisticated respondents such as doctors, I find that the ratings they give to a drug in terms of potency, efficacy, side-effect profile, drug-interactions, cost and value are all likely to be correlated.  More broadly, I find that on many research projects, many of the intangible qualities of the brand that we might measure (brand awareness, attribute ratings, overall evaluations, satisfaction, usage, etc.) are all highly correlated.

Many researchers appear to be unaware of or unwilling to acknowledge such correlations, and will happily make recommendations to tweak a particular quality of the brand in order to improve overall image, satisfaction, purchase intentions, etc.   However, if all these attributes are so highly correlated, advice to tweak one or the other is at best rather meaningless and at worst, rather misleading. 

However, to offset the bad news, there is some good news.  The good news is that the intercorrelations between the many predictor variables means that we do not need to consider a screed of so-called independent measures to assess the health of a brand.  Some clients have had me explore various brand metrics, and what I find is that often-times, we need only look at relatively few numbers rather than many to assess the health of our brand!  Why?  Because of multi-collinearity.  The independent measures are often so highly correlated that they can all be combined into one or at least relatively few scales which capture most of the important intangibles. 

For instance, in research we have conducted in both pharmaceutical and agricultural domains, we have found that we can reduce many of the measures of the intangibles (such as customer attribute ratings of the brand among other things) down to perhaps three dimensions which operate as very strong predictors of brand purchase. 

Of course, you might like to know what those dimensions are, right?  Unfortunately, that would be telling!  Nevertheless, I have given you the key to simplifying the intangible assets of the brand.  You can work it out. 

And as to heteroscedasticity, I will leave that to another day.